Scan QR code or get instant email to install app

Question:
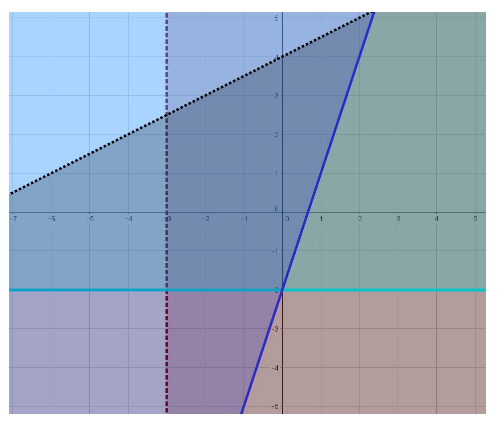
Which set of inequalities produces this graph?
A
1212y \u2265 3x - 2

x > -3
y \u2265 -2
x > -3
y \u2265 -2
explanation
Recall that inequalities containing a less than or greater sign graph as dashed lines and inequalities containing an equal sign graph as solid lines; the distinction indicates whether the points lying along the line serve as solutions to the inequality.
After graphing each of the inequalities using the appropriate line type, determine whether the portion to the left/right or above/below is shaded. The solution set corresponds to the collection of points that satisfies the shading requirements of each of the inequalities.
Take more free practice tests for other PASSEMALL topics with our accuplacer test now!
Related Information
Comments