Scan QR code or get instant email to install app

Question:
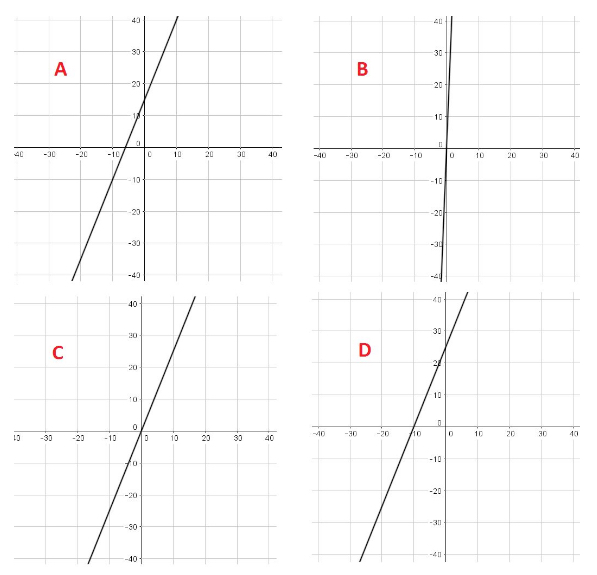
The cost to enter an amusement park is $15. If each ride costs an additional $2.50, the horizontal axis represents the number of rides ridden, and the vertical axis represents the cost, which of the graphs correctly represents the cost function of a trip to the amusement park?
A
A
explanation
If 0 rides are ridden, the total cost is 15. As a result, the y-intercept must be 15. The cost per ride is 2.50, so the slope of the line is 2.5. If 10 rides are ridden, the total cost is 2.5(10) + 15 = 40, which matches graph A.
Take more free practice tests for other PASSEMALL topics with our accuplacer practice test now!
Related Information
Comments