Scan QR code or get instant email to install app

Question:
An analyst gathers the following data about the returns for two stocks.
The correlation between the returns of Stock A and Stock B (pA B) is closest to:
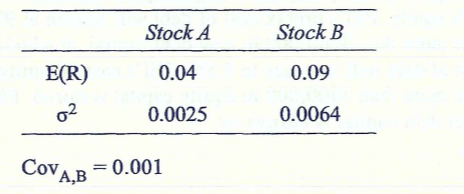
A
0.25.
explanation
1212The correlation between the two stocks is: 
Note that the formula uses the standard deviations, not the variances, of the returns on the two securities.
Take more free practice tests for other PASSEMALL topics with our cfa level 1 practice questions now!
Related Information
Comments