Scan QR code or get instant email to install app

Question:
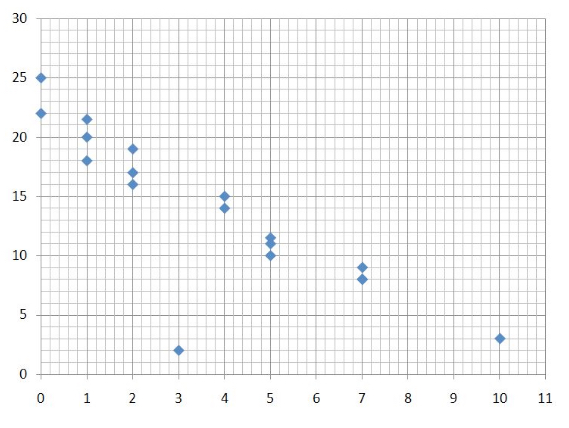
Based on the scatterplot, which of these statements must be true?
A
The data exhibits a negative correlation.
explanation
The point (3, 2) represents an outlier. The line of best fit would pass close by the point (11, 0), but that does not guarantee that data will be in that vicinity - there could be more outliers. Data that is strongly positively correlated shows a steep positive slope. The data shown exhibits a negative slope; consequently, the data exhibits a negative correlation.
Take more free practice tests for other PASSEMALL topics with our accuplacer practice test now!
Related Information
Comments